Fluctuations in daily production, incomplete milkings, kicking off, etc.
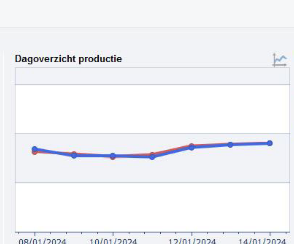
When you look at the Attention board at Daily production overview, there is a symbol of a graph at the top right. If you click on it, a graph will appear where you can see over a longer period what the average daily production has been in the period you specified.
It is interesting to look at this over a period of a year or even longer.
The average number of milkings per day can be seen and also whether more or fewer incomplete milkings or kicking offs occurred in a certain period or on certain days.
Sometimes you see slow changes, sometimes peaks or troughs.
Can you remember why things went less well or better than average in certain periods / days? For example, a major ration change, hoof-trimming day, many new heifers calved, a long standstill due to a malfunction or service, ….. .
And, even better, can some negative changes be prevented in the future?


